Resources
CSBA Fast Facts and Figures
2022–23 CSBA Membership
964
Members

Local educational agencies (school districts, county offices of education and regional occupational centers/programs) are members of CSBA
Membership Rate
Represented

PreK-12 public school students represented by CSBA member LEAs
Local educational agencies (school districts, county offices of education and regional occupational centers/programs) are members of CSBA
PreK-12 public school students represented by CSBA member LEAs
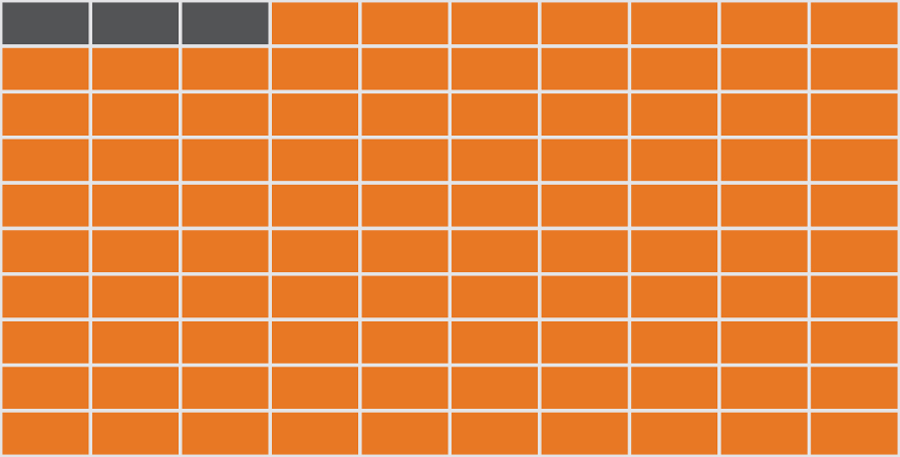
Sizes of K-12 School Districts (based on average daily attendance)


Governing Board Member Demographics
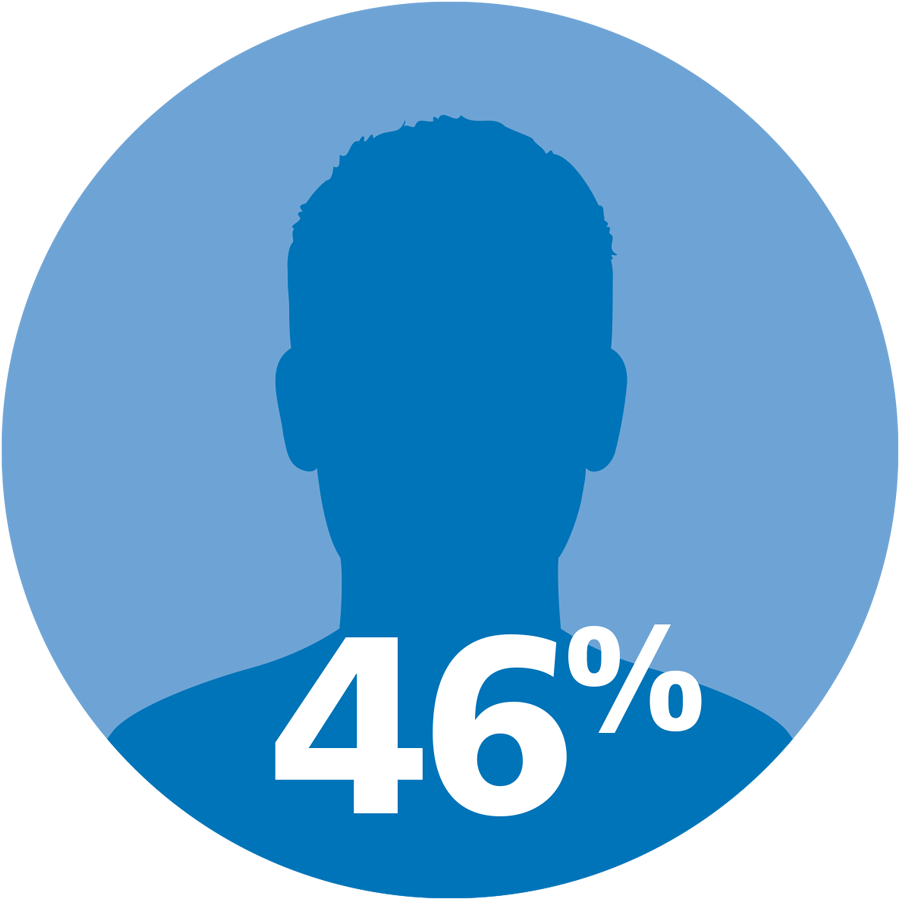
male
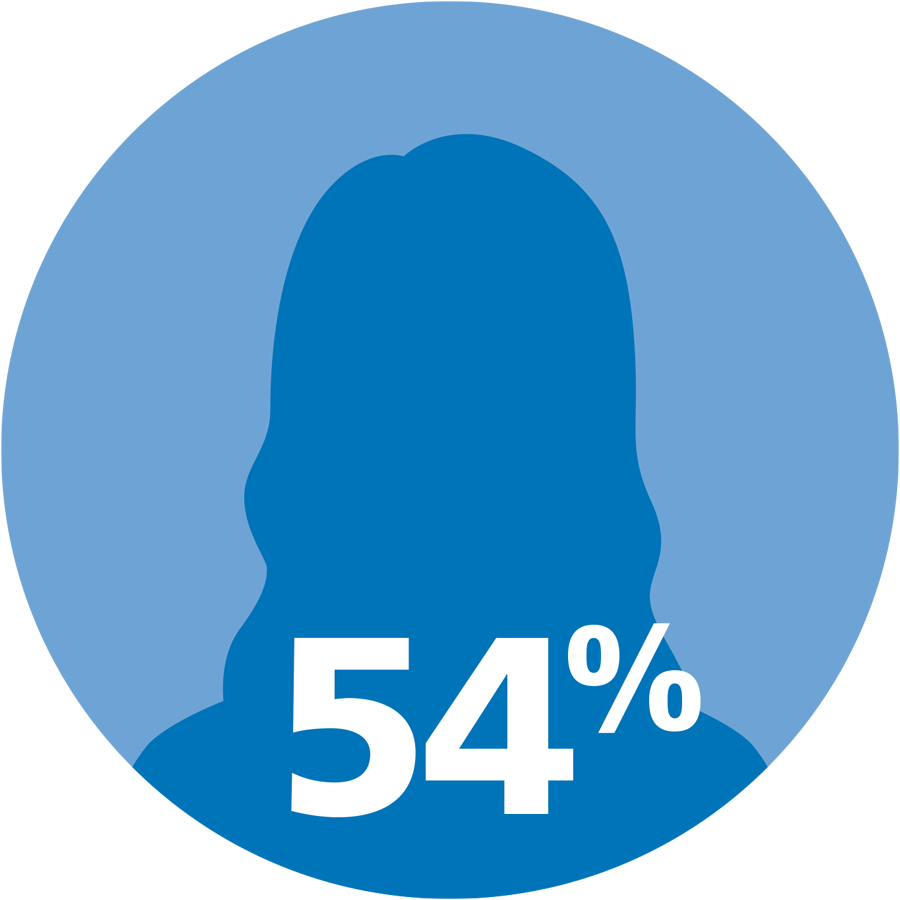
female
88% sample size of statewide board members; remaining 12% “Decline to state” or data not provided

61% sample size of statewide board members; remaining 39% “Decline to state” or data not provided