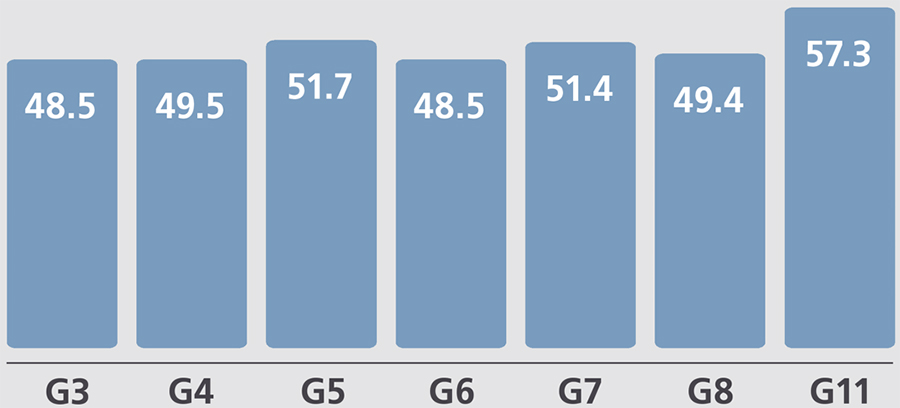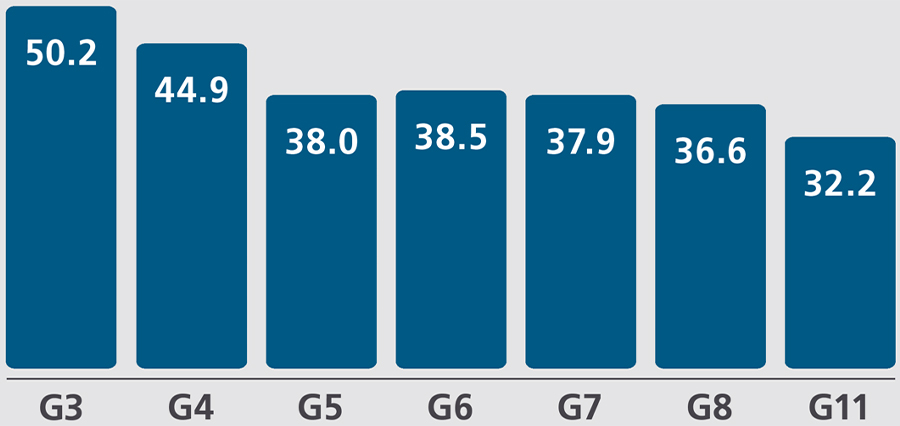
Given that these scores represent the fifth year of implementation, it is a good opportunity to reflect on the trends in California and opportunities and areas for schools, districts and county offices of education to focus on in the future.
The California Assessment of Student Performance and Progress is given to students in grades 3-8 and 11. The Smarter Balanced tests are part of CAASPP, which also includes the California Science Test, standards-based tests in Spanish and the California Alternate Assessments for students who have the most significant cognitive disabilities.
While scores for all grades have been trending up over the past five years, there is still a lot of work to do to improve student outcomes. As seen in figures 1 and 2 (on page 12), nearly half or more students across each grade did not meet grade level standards in ELA or mathematics.
The good news is that there has been a positive upward trend every year. The challenge for every school, district and county office of education is in investing in strategies to speed up the pace of improvement. There are also examples of schools and districts that have seen considerable growth, meaning that there are pockets of innovation and opportunity from which school and district leaders can learn.
Opportunity gaps continue to lead to persistent achievement gaps that have either remained stagnant or only slightly narrowed over the past five years. These gaps show that far too many of California’s 6.2 million public school students are not being provided with the supports they need to meet their potential. Moreover, these gaps disproportionately impact students based on ethnicity, economic status, language status and disability status, among other characteristics.
In fact, tackling these achievement gaps is central to producing acceptable statewide outcomes for all students. Data from two groups that make up a majority of students in California illustrates this need:
- Latinos make up 54 percent of California students, yet only 41 percent met or exceeded grade-level standards in ELA, compared to 65 percent of white students (a 24 percentage-point achievement gap). These gaps persist in math and are even wider when comparing African American and Native American students to their white peers.
- Economically disadvantaged students make up 60 percent of California students, yet only 39 percent met or exceeded grade-level standards in ELA, compared to 69 percent of their wealthier peers (a 30 percentage-point achievement gap). These outcomes are similar in math.


While it is important to note that slight improvements for most student groups have been evident from year to year, the state must start to identify its Latino, African American, Native American, economically disadvantaged, English learner, students with disabilities and other students that have been historically underserved by the system as “high-potential students.” These students deserve added attention by state, county, district and school leaders in order to invest in their potential and begin to see improved outcomes in the coming years.
In reflecting on the Common Core State Standards after the first five years of implementation, it is critical to also remember that scores from each year represent a snapshot of student performance. As such, they are useful at evaluating how a district is serving students in any given year, but not at evaluating growth in student performance from one year to the next. However, the State Board of Education is evaluating options for a growth model, with the possibility of including it in the California School Dashboard as early as November 2020. This would bring California in line with the rest of the nation (except for Kansas), which currently calculates and reports student outcomes with a growth model.

The final thought to consider with the five years of CAASPP scores is that Full and Fair FundingSM will greatly help in supporting district improvement efforts. California public schools must do better at preparing students for college, career and life success, and at closing opportunity gaps. But at the same time, demands on public schools have increased over the past two decades, including new standards and mandates, the need to upgrade facilities, the demands of a global economy and increasing need for student social-emotional supports, to name a few. Unfortunately, increasing demands have not come with the necessary financial support from federal and state leaders.
It is for this reason that although it is important to recognize the challenge that these scores highlight, leaders, educators, parents and community members must also continue to push for Full and Fair Funding for California schools so that it moves from one of the lowest 10 states in per-student funding to one of the top 10 over the next decade.
To review statewide, county, district, and school CAASPP scores, visit https://caaspp-elpac.cde.ca.gov/caaspp/.