

Today, educationis perhaps the most important function of state and local governments … In these days, it is doubtful that any child may reasonably be expected to succeed in life if he is denied the opportunity of an education. Such an opportunity, where the state has undertaken to provide it, is a right which must be made available to all on equal terms …”
— Brown v. Board of Education of Topeka, Kansas
Almost 65 years after U.S. Supreme Court Justice Earl Warren delivered the unanimous opinion in Brown v. Board, the right to education on equal terms remains elusive. Brown effectively ended de jure segregation in American schools, but de facto segregation remains commonplace and disparities abound along racial, gender and socioeconomic lines. While the nation has grown ever more diverse in the decades since Brown, its ability to meet the needs of a changing student population has failed to keep pace. That failure comes with a steep price in terms of lost potential, forgone prosperity and abdication of our stated values.
America is experiencing levels of economic inequality that are unprecedented in the post-war era, a condition that, in a kind of unvirtuous circle, both results from and exacerbates longstanding divides in social outcomes, particularly along ethnic and racial lines. But of all the ways in which inequality hinders American progress, gaps in educational achievement are perhaps the most pernicious — and also the most complex.
Today, education
is perhaps the most important function of state and local governments … In these days, it is doubtful that any child may reasonably be expected to succeed in life if he is denied the opportunity of an education. Such an opportunity, where the state has undertaken to provide it, is a right which must be made available to all on equal terms …”
— Brown v. Board of Education of Topeka, Kansas
Almost 65 years after U.S. Supreme Court Justice Earl Warren delivered the unanimous opinion in Brown v. Board, the right to education on equal terms remains elusive. Brown effectively ended de jure segregation in American schools, but de facto segregation remains commonplace and disparities abound along racial, gender and socioeconomic lines. While the nation has grown ever more diverse in the decades since Brown, its ability to meet the needs of a changing student population has failed to keep pace. That failure comes with a steep price in terms of lost potential, forgone prosperity and abdication of our stated values.
America is experiencing levels of economic inequality that are unprecedented in the post-war era, a condition that, in a kind of unvirtuous circle, both results from and exacerbates longstanding divides in social outcomes, particularly along ethnic and racial lines. But of all the ways in which inequality hinders American progress, gaps in educational achievement are perhaps the most pernicious — and also the most complex.
ducation outcomes are influenced by a variety of issues such as family income and educational attainment, school and instructional quality, physical, social and emotional health, and access to early learning opportunities. Our effectiveness in closing achievement gaps will determine whether these disparities persist in future generations and whether America can come closer to achieving its potential, both in moral terms and practical ones.
The “Great Gatsby Curve”
In 2015, the Pew Charitable Trusts released a report by David Grusky and Pablo Mitnik of Stanford’s Center on Poverty and Inequality that found that roughly half of parental income advantages are passed on to the next generation and that children born to parents who rank in the 90th percentile for earnings will typically make three times more than the children of parents in the 10th percentile. These statistics dramatize what Alan Krueger, former chairman of the Council of Economic Advisers, calls the “Great Gatsby Curve” — the connection between economic mobility and family income.
Krueger looked at income inequality in 10 developed countries and examined the extent to which a child’s income was based on their parent’s earnings and found that the correlation was far less in Denmark, France, Germany, Japan, New Zealand, Norway and Sweden than it was in the United States. Krueger’s findings are confirmed by numerous other studies that show that, in America, a parent’s education has greater impact on a child’s financial, academic and socio-emotional outcomes than in most peer countries.
“Other peer countries have their, often unacknowledged, problems as well, but most have policies to provide a modicum of desegregation in their urban schools,” said Patricia Gándara, research professor and co-director of the Civil Rights Project for the University of California, Los Angeles. “For example, France sorts teachers randomly, at least initially, so that all the best teachers are not in particular schools. The northern [European] countries are explicit about mixing students. The evidence for this is that economic mobility is now greater in Western Europe than in the U.S. because all kids have more access to decent schools.”
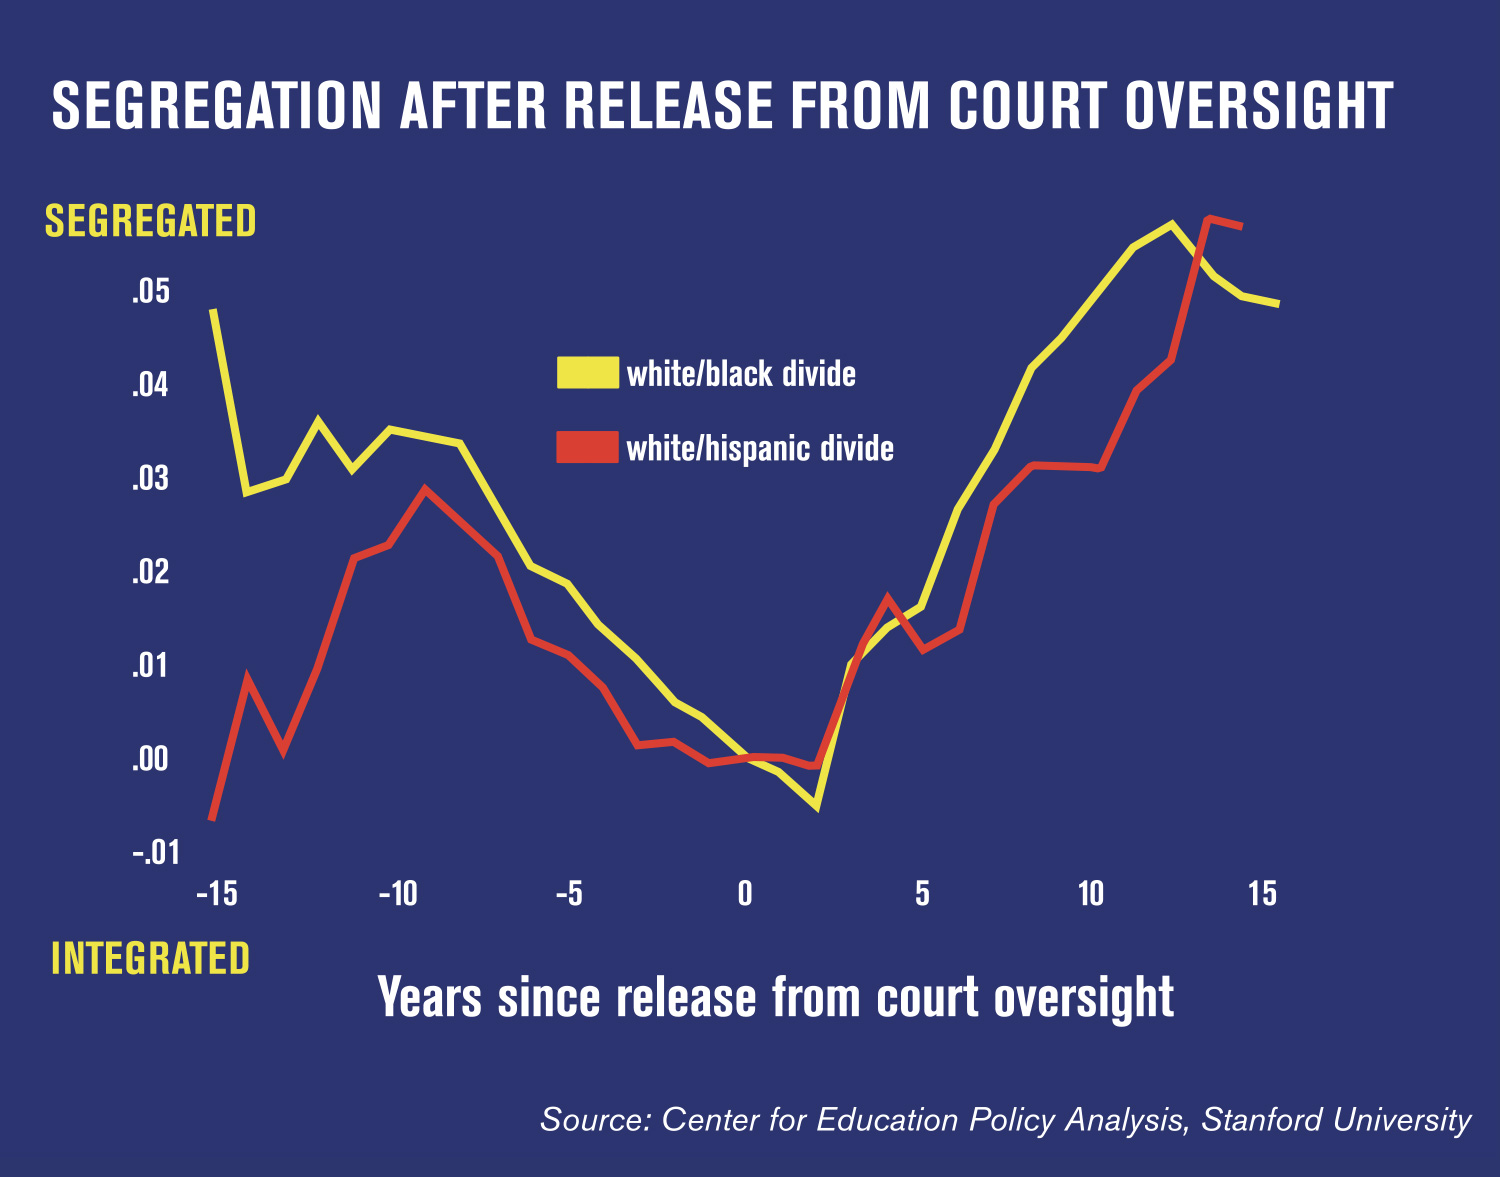
Segregation revisited
Gándara’s colleagues at the Civil Rights Project, Gary Orfield, Jongyeon Ee, Erica Frankenberg and Genevieve Siegel-Hawley, documented the resegregation of America’s schools in a 2016 paper, Brown at 62: School Segregation by Race, Poverty and State. The team found that the number of highly segregated non-white schools (defined as a white student population of 10 percent or less) tripled from 1991 to 2007, growing from 5.7 to 18.6 percent. During that same period, the number of white students in schools with primarily minority student bodies fell by roughly half as schools that were once mostly minority became almost exclusively so.
“Economic mobility is now greater in Western Europe than in the U.S. because all kids have more access to decent schools.”
— Patricia Gándara, Research Professor and Co-Director of the Civil Rights Project for the University of California at Los Angeles
The 21st-century data continues a trend that began in the late 1980s, when school desegregation reached its peak, and accelerated after U.S. Supreme Court decisions restricted desegregation policy. Notable among those cases is a 1991 ruling in Board of Ed. of Oklahoma City v. Dowell, when the justices declared that court-ordered school desegregation was only a “temporary measure.” The effects of these rulings have combined with demographic changes to create a student experience where black and Latino students are increasingly isolated. In California, 54 percent of public school students are Latino and Latino students are more segregated than anywhere else in the country. California’s African-American students are the second most segregated of any state, just behind New York.
This resegregation of our schools would be (slightly) less troubling if black and Latino students in highly segregated environments were achieving comparable results to their white and Asian peers or on a trajectory to do so at any point in the foreseeable future. Unfortunately, that’s not the case. This is especially alarming in California where demographics and high poverty rates place a premium on educating students who are poor, English learners, Latino or African-American.
“Looking at the data, it’s clear that we have yet to fulfill the promise of Brown v. Board. We’ve yet to truly fix the inequitable cracks built into the foundation of our education system. In California, we still see disparities in access, despite local control,” said Education Trust-West Co-Interim Director Elisha Smith Arrillaga. “We see stories in the news about teachers and students using racial slurs. Recent state test results showed that we haven’t done nearly enough to support the educators in classrooms teaching our new content standards. Our current pace of improvement is too slow, suggesting we won’t close gaps for a generation unless we take serious action now.”
The California Department of Education uses a combination of coursework, scores on state standardized tests and completion of career and technical education pathways in its “College/Career Indicator,” a metric of a student’s college readiness and professional prospects. In California’s 2015–16 cohort, 60 percent of Asian students were judged college-ready according to the CCI, a number that fell to 52 percent for white students and plummeted to just 25 percent for Latinos and 17 percent for African-Americans. These figures roughly mirror the results for ethnic groups on the state’s standardized tests, results that researchers say can’t be fully explained by differences in socio-economic status.
Clearly, there’s much work to do in producing equitable outcomes for poor students and students of color. That fact is further documented by a series of reports in the Getting Down to Facts II research project. In a Portrait of Educational Outcomes in California, a group led by Stanford professor Sean Reardon and RAND Corporation policy researcher Chris Doss point out that, despite notable progress since the first Getting Down to Facts report 20 years ago, California students still trail the national average in the National Assessment of Educational Progress. They also explain that this difference is concentrated in schools where most students come from families of middle or low socio-economic status, noting that in nonaffluent districts, California students perform almost a full grade level below their nonaffluent peers nationwide. In contrast, there is almost no difference in the performance of California students who attend schools in affluent districts and their peers across the country.
Trailing the nation
“In summary, California continues to perform poorly relative to the country despite two decades of progress. California is particularly behind among poor and middle-class districts; this accounts for the difference between California and the U.S. in white-black and white-Hispanic achievement gaps,” Reardon, Doss and their colleagues wrote in the report. “These disparities appear to be partly or largely due to gaps in school readiness; California students appear to learn at the same or a slightly better rate from grade three to eight as other students nationwide. Though California had been making progress in the last decade among low, average, and high SES [socio-economic status] districts, data from 2015 show a reversal of that progress in poor and middle-class districts from 2013 to 2015. Educational opportunities in small towns and rural communities are particularly lacking.”
“California is particularly behind among poor and middle-class districts; this accounts for the difference between California and the US in White-Black and White-Hispanic achievement gaps.”
— Portrait of Educational Outcomes in California
The report argues that this difference is not entirely attributable to the quality of the schools California students attend, but also reflects broader social conditions. “Even when they enter kindergarten California students in low-income districts lag behind their national peers, indicating that the patterns … precede children’s experiences in California’s elementary and middle schools. Moreover, data from third through eighth grade suggest that, once students begin school, their academic achievement increases slightly faster in California than the average nationwide.” That accelerated progress, however, is not enough to compensate for the wide gaps in student readiness that children bring with them when they enter school for the first time.
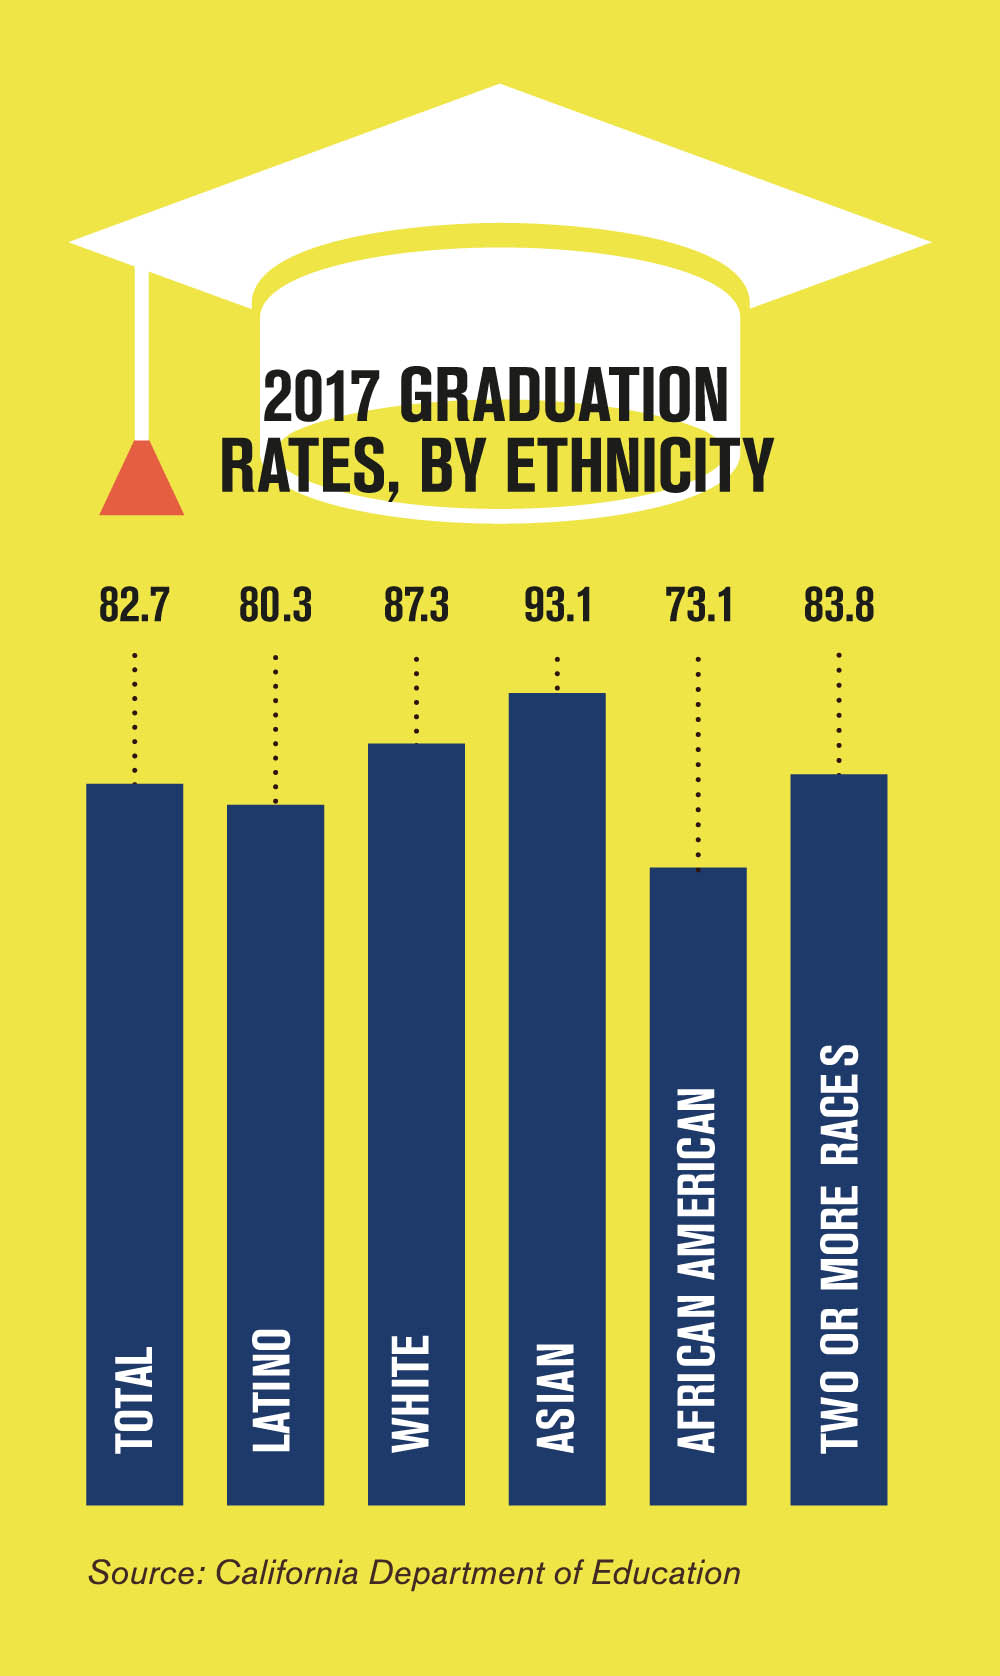
Amidst these depressing findings, signs of hope exist in the form of rising high school graduation rates, an increase in the percentage of graduates eligible for the University of California and California State University systems, higher enrollment in Advanced Placement classes and more students demonstrating proficiency in foreign languages. Overall, 82.7 percent of California students who started ninth grade in 2013–14 graduated in 2017, up from 74.4 percent for the class of 2010. Graduating students are also better prepared for postsecondary education. From 2007 to 2015, the state saw an 8.1 percentage point increase (32.7 to 40.8) in the number of high school graduates eligible for admission to CSU schools. The percentage of graduates eligible for UCs ticked upward slightly from 13.4 to 13.9 over that same period, but didn’t match the high of 14.4 percent in 2003.
Yet, whether the overall results are encouraging (higher graduation rates) or disappointing (largely stagnant test scores) an alarming throughline connects the data — results for black and Latino students are dramatically worse than for their white and Asian peers. As the Education Trust-West documents in The Majority Report: Supporting the Success of Latino Students in California, Black and Latino students are less likely to be placed in gifted and talented programs, to have access to college preparatory classes, to graduate high school and to complete college, and more likely to be suspended or expelled, to be taught by inexperienced teachers and to require remedial classes in college. While the size of these gaps has shrunk over the past 20 years, it’s done so at a glacial pace. California remains far from the day education is a right that is “available to all on equal terms.”
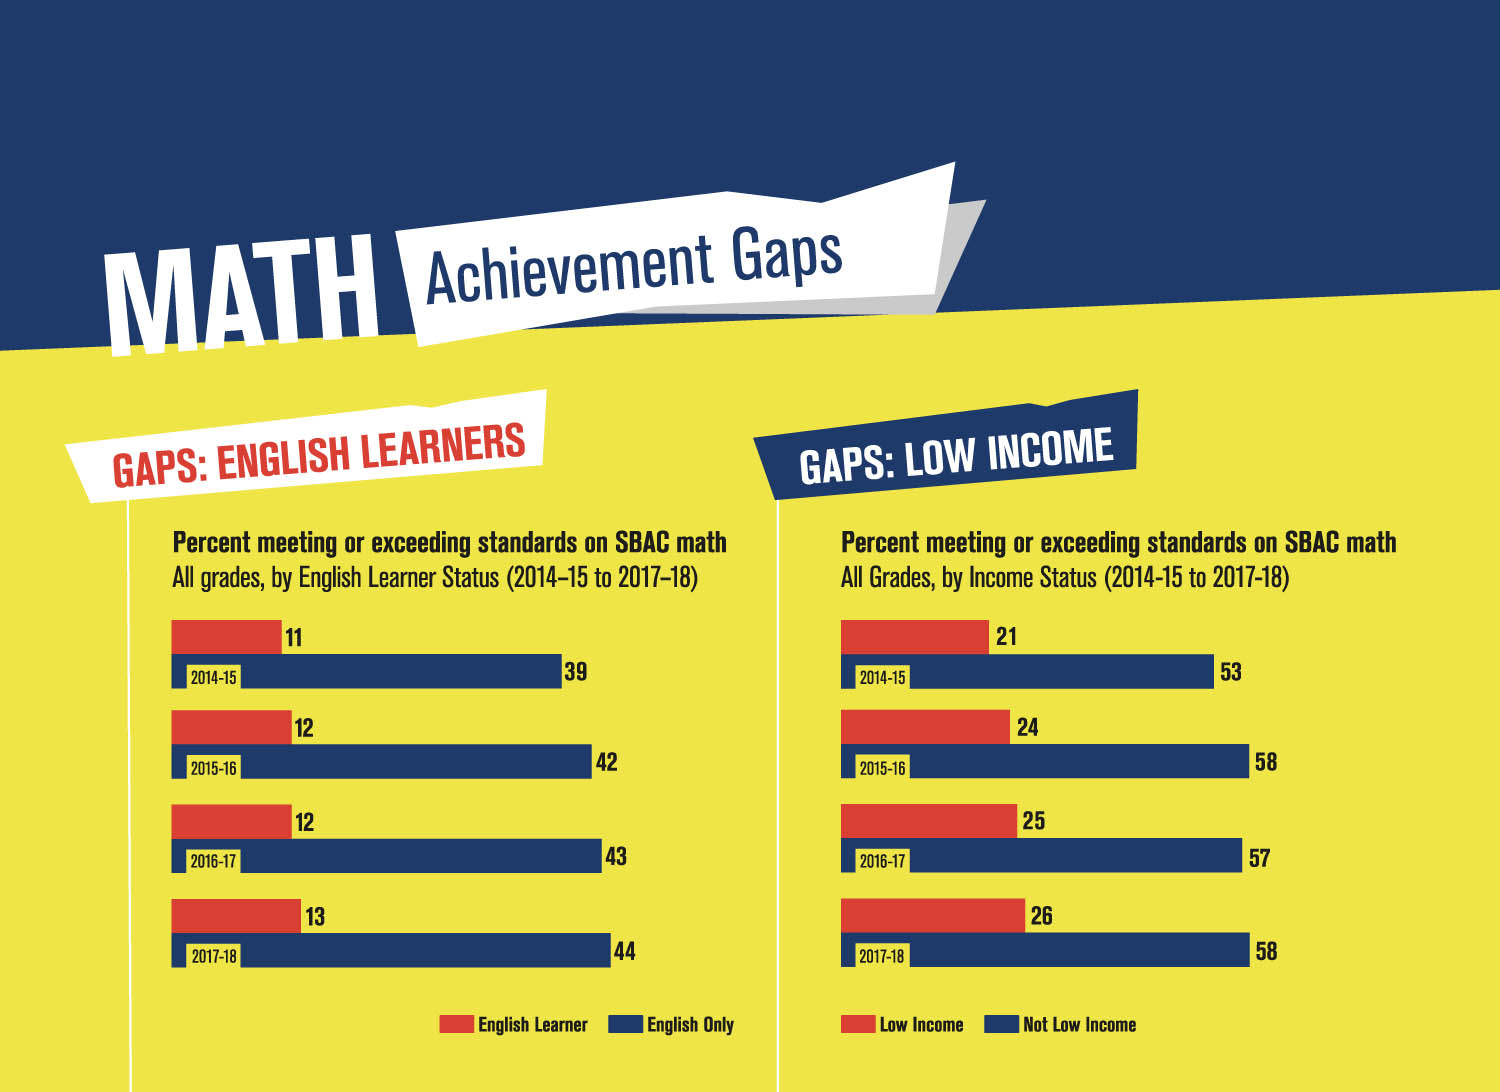
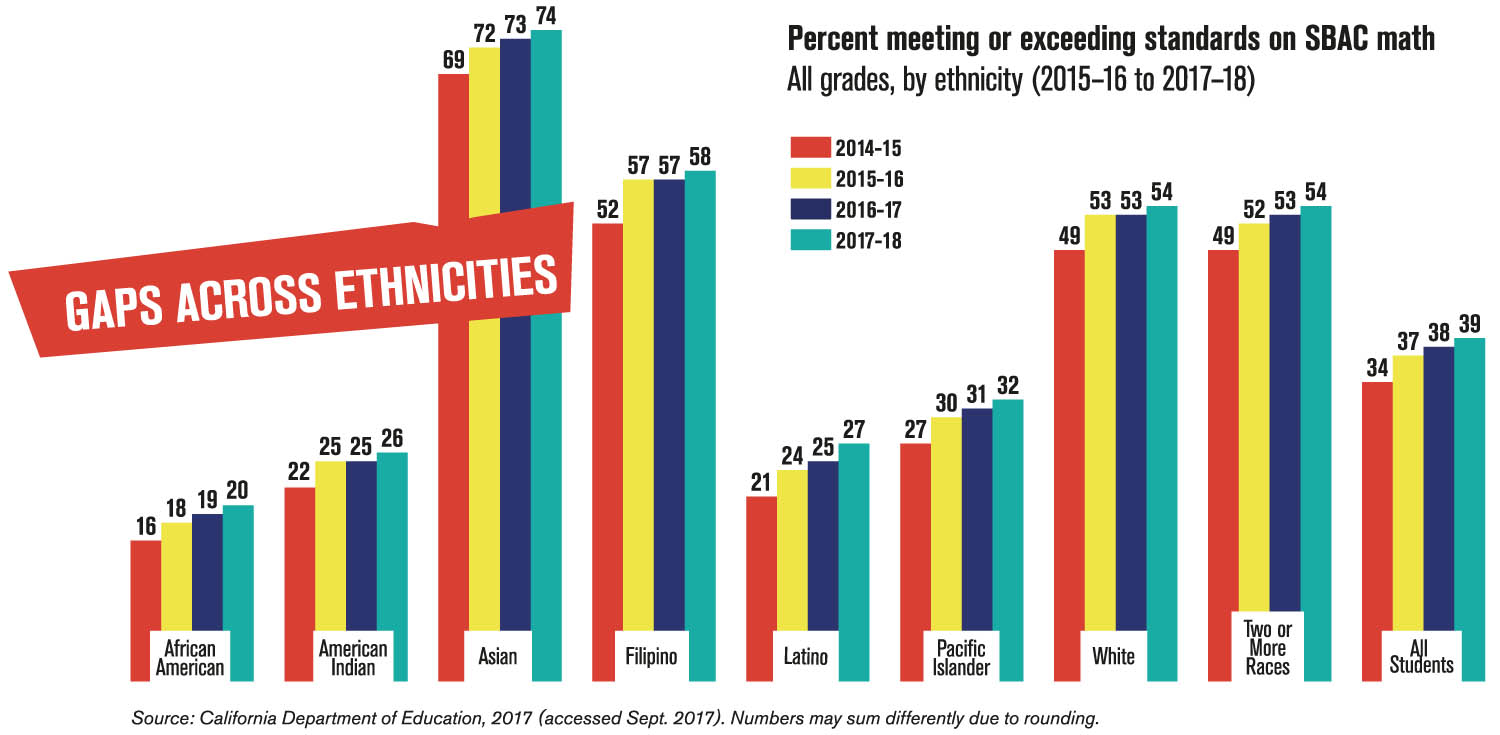
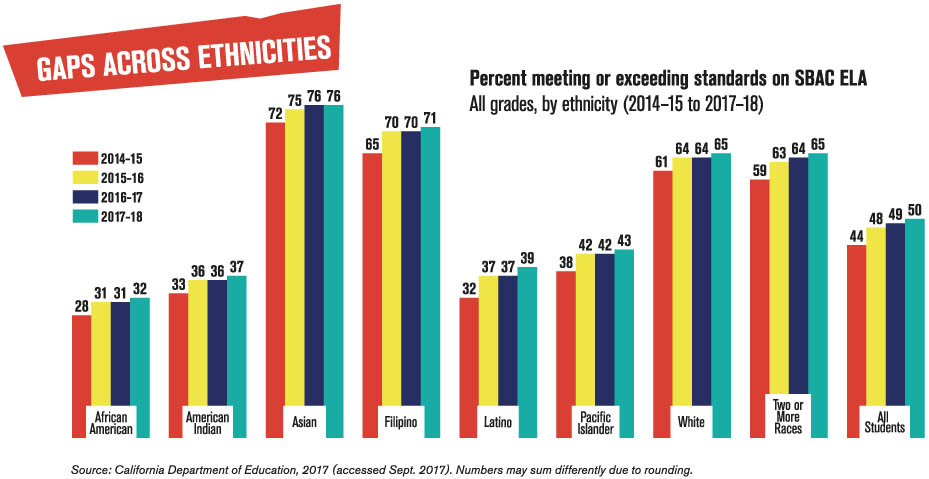
A look at the 2017–18 Smarter Balanced Assessment Consortium results illustrates this point. The Smarter Balanced, or SBAC, are assessments in English language arts/literacy and math taken by students in grades three through eight and grade 11. Smarter Balanced is the foundation of the California Assessment of Student Performance and Progress, the state’s standardized testing system. In 2018, half of all students (49.9 percent) met or exceed standards in ELA, a statistic that conceals a broad range of performance across different ethnic groups. While 76 percent of Asian students and 71 percent of Filipino students (which the California Department of Education disaggregates) met or exceeded the standard, only 65 percent of white students did, 43 percent of Pacific Islanders, 39 percent of Latinos, 37 percent of Native Americans and 32 percent of African-Americans. On the math assessments, 38.7 percent of all students equaled or surpassed the standard: 74 percent of Asian students cleared the bar, compared to 59 percent of Filipino students and 54 percent of white students. Just 32 percent of Pacific Islanders students, 27 percent of Latinos, 26 percent of Native Americans and 20 percent of African-Americans students met or exceeded the math standards.
Smith Arrillaga of Ed-Trust West acknowledged that the state has made progress on some fronts, particularly in the form of rising high school and college graduation rates and an increased focus on equitable funding and college and career readiness. Yet, she cautions that clear, concrete action is needed to translate those points of emphasis into improved outcomes for students.
“We are seeing more of a focus on equity in schools, though we also need to talk about educational justice. Equity becomes a buzzword when we aren’t explicit about how to do it, about what actions it involves,” Smith Arrillaga said. “We’re also seeing an increased effort to have conversations about how bias plays out in education decision-making, with renewed calls for teacher training and the supports to have conversations about race and inequity. These efforts have the power to make a tremendous impact on how we think about schools and students — if we have the courage to have the uncomfortable conversations that will push educators, advocates and education leaders to all be better.”
The cost of inequity
It’s clear that the education tide is not raising all boats equally and that the students most at-risk of drowning are black, Latino, Native American and Pacific Islander — as well as those who are simply poorer than their peers. What’s less obvious to some is the impact this has on the nation as whole. There is no one in America, black or brown, white or Asian, rich or poor, who is untouched by the human and economic toll of America’s vastly inequitable public school systems.
In the Economic Benefits of Closing Educational Achievement Gaps, Robert Lynch, chair of the Economics Department at Washington College, and Patrick Oakford of the Center for American Progress found that if the United States closed the achievement gaps between white children and black and Hispanic children, it would increase American gross domestic product by an average of $551 billion per year, or $20.4 trillion by the year 2050. Lynch and Oakford also found that eliminating racial achievement gaps would increase tax collections by the tune of $110 billion a year at the federal level and boost state and local revenues by $88 billion annually. The authors summarized the data by noting that, “Government investments in closing educational achievement gaps that cost less than an average of $198 billion annually over the next 37 years would pay for themselves even in strictly budgetary terms.”
The authors are quick to add that even those numbers underestimate the value of closing racial achievement gaps because they isolate the impact of improved outcomes specifically for black and Latino students, and don’t consider the spinoff effects on other students or society in general. “First, they assume that educational achievement improvements are limited to black and Hispanic children; in the real world, policies that increase these children’s educational achievement are likely to improve all children’s achievement,” Lynch and Oakford wrote. “Second, the model does not take into account any of the social benefits — such as better health outcomes — that are likely to occur as a result of educational improvement. Finally, the model does not calculate the potential positive effects on children born to future parents who, because of improved academic achievement, will have higher incomes and thus be able to provide them better educational opportunities. If the model properly accounted for all of these factors, the benefits of improving educational achievement would be substantially larger than those estimated in this study.”
A race against the clock
While Lynch and Oakford’s accounting measures the cost of inequitable outcomes, there is also tremendous inequity where inputs are concerned, specifically the access to high-quality instruction and resources that are afforded to low-income and black, Latino, Native American and Pacific Islander students. The Opportunity Myth, a September 2018 study by the New Teacher Project, found that when students were challenged and given the opportunity to meet high expectations, they succeeded more often than not. Despite resources, mostly white classrooms and classrooms with mostly students of color had fairly similar success rates: 65 percent to 55 percent respectively, when presented with grade-level work. Yet, among classrooms composed of mostly minority students, 38 percent — nearly 4 out of 10 — never received a single grade-level assignment. Not one. The comparable figure for white classrooms was 12 percent.
The Civil Rights Data Collection, which examines topics such as college and career readiness; school discipline; retention rates; and access to courses, programs, instructional staff, resources and early learning opportunities, offers similar conclusions that can inform the work of school boards, staff and communities as they develop policies and programs to increase equitable outcomes for students.
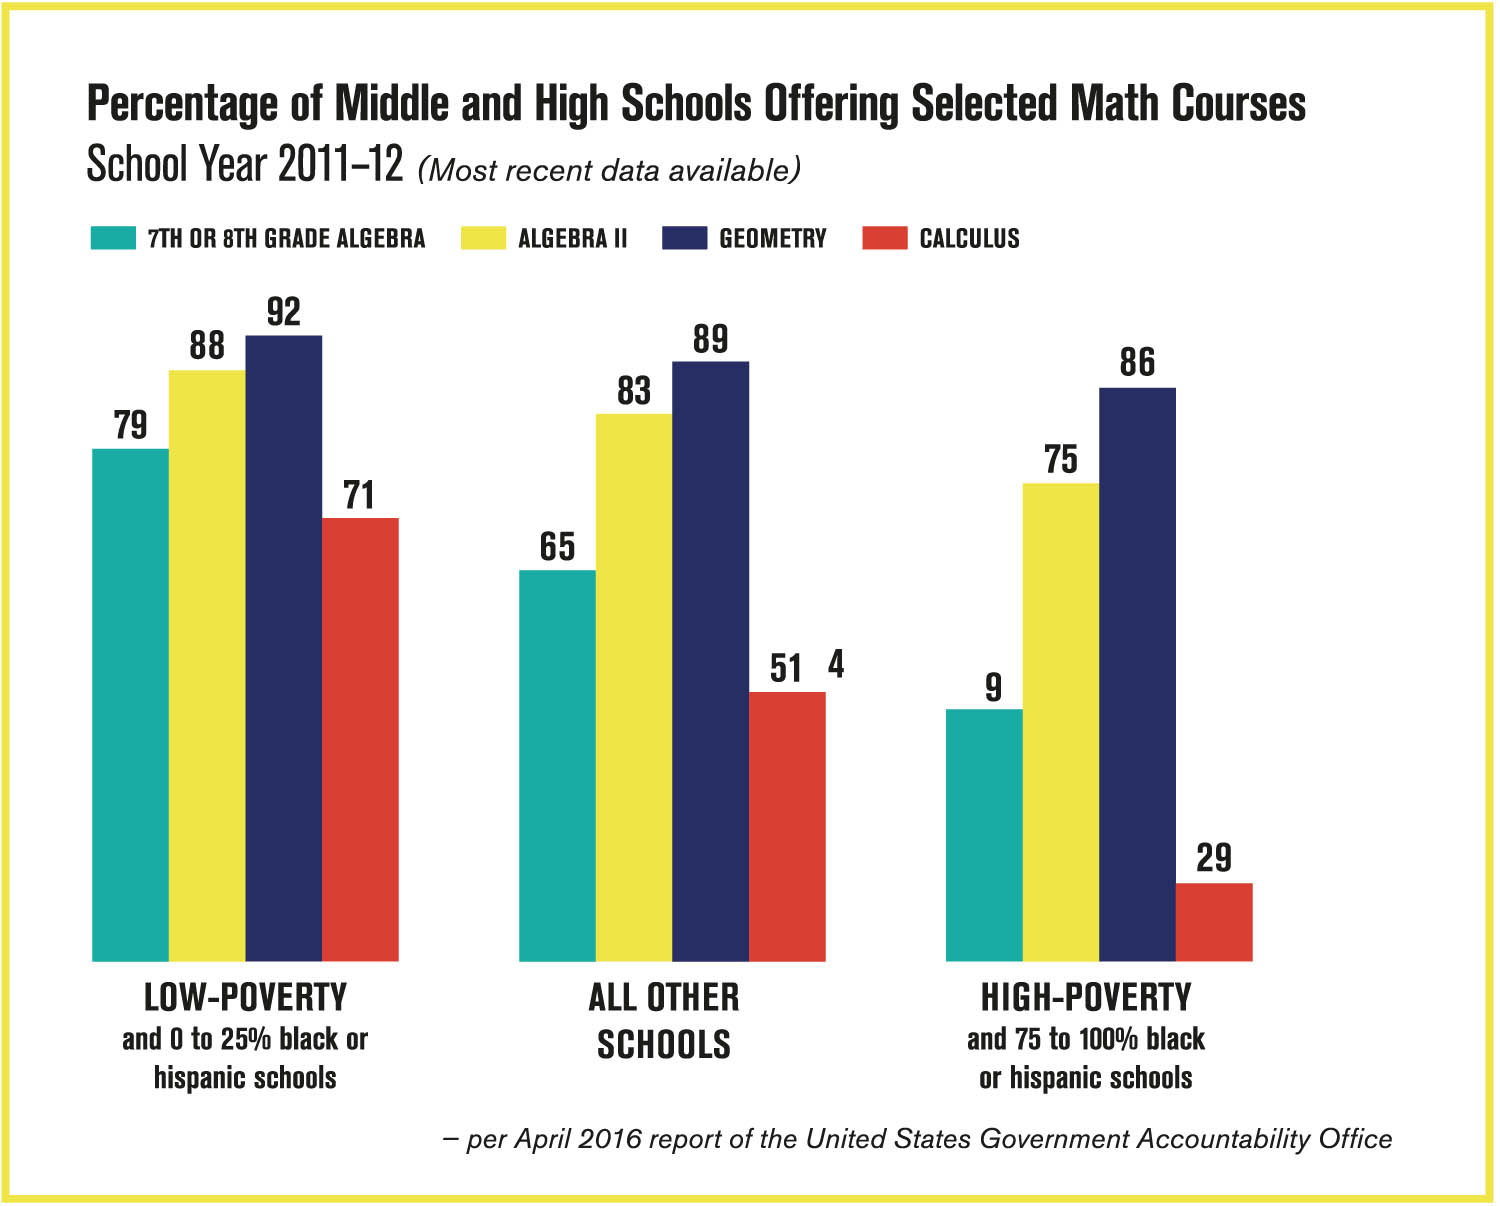
According to the collection, just over half — 54 percent of school districts — provide preschool programs beyond services they are required to offer specifically to students with disabilities as part of the federal Individuals with Disabilities Education Act. More than half of high schools nationwide do not offer calculus, four in 10 do not offer physics, more than one in four do not offer chemistry and more than one in five do not offer Algebra II. African-American and Latino students, in particular, lack access to a rigorous curriculum and college preparatory courses. Just one-third of all high schools with high African-American and Latino enrollment have a calculus course and less than half teach physics, while two-thirds offer chemistry and nearly three in 10 don’t even have Algebra II or equivalent courses.
Where discipline is concerned, African-American students are 3.8 times more likely to receive a suspension than their white peers, and American Indian, Alaska Native, Latino, Native Hawaiian and Pacific Islander students were also suspended at disproportionate rates. Students with disabilities are more than twice as likely as to receive an out-of-school suspension as students without disabilities.
The role of school boards
“Board members have to define what equity is for themselves and have a clear moral imperative about this work instead of a compliance attitude when creating policy. Unfortunately, a policy can be created with great intentions and it won’t have an impact if there’s no real urge to transfer policy into practice,” said Nicole Anderson, a Bay Area-based education consultant focused on equity issues. Anderson leads CSBA’s Equity Network, a Stuart Foundation-supported project to provide school board members with the skills and understanding needed to make equity-based decisions. The network convenes board members from across the state to develop practices that aid school district and county offices of education as they work to adopt and implement policies that increase equity.
“Board members are often tasked with creating policies without having clear context about how it will impact the people who implement them,” Anderson explained. “They should dive into those issues and the collaborative side of things, have a heart-to-heart with board colleagues and also a conversation — more of an alliance — with their constituencies and stakeholders who have personal and political power.”
Anderson recommends that board members carefully review data, not only for academic results but also for school culture, attendance and discipline to gain a sense of where inequity lies, get a handle on its scope and — in concert with staff, students and community — identify what’s causing the disparities as well as potential remedies. She notes that, in addition to the quantitative results reported through the California School Dashboard and the internal metrics prepared by district staff, board members can use qualitative data like surveys, observation and conversations with students to acquire a greater understanding of the challenges and opportunities on the road to equity. She also encourages boards to draft policy with the assistance of context experts and to look beyond the school district for opportunities to support students.
That advice is seconded by Gándara of the UCLA Civil Rights Project, who says that, “The vast inequities in our society cannot be eradicated by schools alone, it must be a partnership with government — state, local and federal. Right now, we have a huge problem of gentrification in urban areas around the country. This is potentially an opportunity if local government establishes housing policies that protect long-term residents while enticing new middle-class residents with children to strong magnet schools in the same area. That is, denser housing, policies to keep lower-income families in place and attractive options for young, middle-class families in the schools. Dual language programs are a great example of the kind of magnets that can be uniquely attractive and possible in these gentrifying neighborhoods — but it requires a partnership, and some federal dollars could be very helpful.”
A house divided
The intricate relationship between housing policy and education outcomes is a nationwide phenomenon, but nowhere is the housing crisis more intense and the effects of gentrification more pronounced than in California. Solutions, at least those that have broad consensus, are in short supply — as are the state and federal dollars needed to fund them. Building more affordable housing, particularly in higher-income communities, is an approach that some researchers recommend to help increase educational outcomes, in addition to the direct benefit of simply having more affordable housing. In the words of David Rusk, former federal Labor Department official and author of Cities without Suburbs, “School enrollment patterns are closely tied to residential patterns. In short, housing policy is school policy.”
Montgomery County, Maryland, which ranks as one of the 20 wealthiest counties in the U.S., demonstrates the impact of housing policy on student outcomes. Starting in the 1970s, Montgomery County required that developers building subdivisions reserve 12 to 15 percent of units for affordable housing, a decision that integrated the area and gave more students from low-income families access to the high-performing school system. Today, about a third of the 161,000 students in Montgomery County Public Schools qualify for free and reduced-price meals. In a 2010 paper, Housing Policy is School Policy, the Century Foundation’s Heather Schwartz wrote that, “Although an increasing share of the population of this suburban school district just outside Washington, D.C., is low income, and the majority of its students belongs to racial minority groups, the county graduates nine in 10 of its students. Two-thirds of its high school students take at least one Advanced Placement course, and the average SAT score in the district greatly exceeds the national average.”
Since 2013, a majority of America’s public school students (now 56 percent in California) have been classified as low-income. According to the Urban Institute, that’s up from 38 percent in 1998. That same analysis found that just six percent of middle- and upper-income students attend high-poverty schools where more than 75 percent of the students are from low-income families, and that low-income students were over six times more likely to attend such a school. As of the 2015–16 school year, 45 percent of Latino, 45 percent of black, 37 percent of Native American and 25 percent of Pacific Islander students attended high-poverty schools, all above the national average of 24 percent. In contrast, 15 percent of Asian students and 8 percent of white students attended high-poverty schools.
These numbers are significant because even the U.S. Department of Education found that “many high-poverty schools receive less than their fair share of state and local funding, leaving students in high-poverty schools with fewer resources than schools attended by their wealthier peers.” That was the conclusion of a 2011 DOE report Comparability of State and Local Expenditures Among Schools within Districts: A Report from the Study of School Level Expenditures. High-poverty schools generally serve student populations with greater need for supports, services and interventions — practices that require more money, not less. The insufficient funding levels at these schools results in reduced access to rigorous curriculum, college and career preparatory programs, experienced and highly qualified teachers, extracurricular opportunities and other components of a strong educational program.
“The line ‘Every system is perfectly designed to get the results it achieves’ comes to mind,” Smith Arrillaga said. “And when we look at our country’s unique history, we can’t divorce conversations about the history of inequities in education from the history of inequities in our other systems too – from the redlining that solidified wealth accumulation for certain groups at the expense of others to the multiple ways government stimulus programs historically discriminated against people of color. We’re going to need a series of bold, equity-driven decisions to truly course correct these patterns and repair the discriminatory cracks in the foundation that we built. The good news here is that, just as individuals have at times made choices that held students back, they can also make choices to do the opposite.”
Leveling the playing field
California’s signature effort to address inequity is the Local Control Funding Formula. Introduced in 2013, LCFF changed the distribution of state funds to provide more money to districts and schools with large numbers and high concentrations of low-income students, English learners, and homeless and foster youth. LCFF was a significant and welcome philosophical departure from previous funding models in that, for the first time, it tried to align the distribution of funding with student need, while also easing restrictions on how districts could spend the money. LCFF didn’t expand the size of the overall school funding pie beyond what was already provided for under California law, but it did reorganize how those funds were distributed. After hitting the LCFF funding targets set by Gov. Jerry Brown, California’s per-student funding levels have returned to slightly above where they were in 2008, before the last recession. More of those funds, however, are reaching the neediest students. Under LCFF, districts with large numbers of disadvantaged students saw their per-pupil funding levels rise under LCFF, and five years out, there are signs that this approach is moving student achievement in a positive direction.
Rucker C. Johnson, associate professor at the University of California, Berkeley’s Goldman School of Public Policy, and Sean Tanner of the Learning Policy Institute (and now with WestEd) documented this progress in Money and Freedom: The Impact of California’s School Finance Reform on Academic Achievement and the Composition of District Spending.
“We find that LCFF-induced increases in school spending led to significant increases in high school graduation rates and academic achievement, particularly among poor and minority students. A $1,000 increase in district per-pupil spending experienced in grades 10-12 leads to a 5.9 percentage-point increase in high school graduation rates on average among all children, with similar effects by race and poverty,” Johnson and Tanner wrote. “On average among poor children, a $1,000 increase in district per-pupil spending experienced in eighth through 11th grades leads to a 0.19 standard deviation increase in math test scores, and a 0.08 standard-deviation increase in reading test scores in 11th grade. These improvements in high school academic achievement closely track the timing of LCFF implementation, school-age years of exposure and the amount of district-specific LCFF-induced spending increase. In sum, the evidence suggests that money targeted to students’ needs can make a significant difference in student outcomes and can narrow achievement gaps.”
The idea that greater resources help close achievement gaps and elevate overall student performance is nothing new to CSBA. In 2015, CSBA’s Education Legal Alliance published California’s Challenge: Adequately Funding Education in the 21st Century. The report updated findings from the 2007 Getting Down to Facts report and concluded that California would need to increase school funding by approximately $23 billion annually to provide all students with a high-quality education. In making the case, the report states that, “The failure to commit adequate resources to fully fund education, when combined with the needs of California’s student population, has created an achievement gap that, without additional resources, is unlikely to be closed. Notably, California has the highest percentage of English learners and low-income students in the country, as well as a higher poverty rate than any other state. Although the LCFF is designed to more equitably address the needs of these students, the intent of the LCFF to return all districts to at least 2007–08 funding levels is still woefully short of what is realistically needed to fund California’s K-12 educational program.”
That assessment mirrors the findings of a September 2018 report in the Getting Down to Facts II compendium, What Does It Cost to Educate California’s Students? A Professional Judgment Approach. That study, authored by an American Institutes for Research team led by Jesse Levin, declared that California would need to increase spending by 32 percent, or roughly $22 billion a year, in order to “adequately” fund education. Even then, each California student would receive thousands of dollars less in state funding than their peers in most of the northeastern states.
CSBA took the issue of equitable school funding to the courts in Robles-Wong v. State of California. The plaintiffs argued that California’s education finance system violates Article IX of the state constitution mandating that the state “provide for a system of common schools.” Robles-Wong was appealed to the California Supreme Court which, by a 4-3 margin, declined to hear the case. In its decision, the majority stated that school funding was the province of the Legislature, not the judiciary, and that the state was only required to maintain a free and accessible public school system, not to guarantee any level of educational quality.
That reasoning prompted three scathing dissents, including one in which Justice Godwin Liu wrote that, “The schoolchildren who brought these actions do not claim they are entitled to a world class education. They ask only whether the California Constitution protects them from being deprived of a minimally adequate education. They are asking the judiciary, as the ultimate guarantor of constitutional rights, to define and safeguard their fundamental right to education.”
Finding no relief from the judiciary, CSBA is calling on the state to increase funding for California’s public schools to the national average by 2020 and to the average of the top 10 states by 2025. Most of the state’s school districts and county offices of education have passed resolutions urging the Legislature to make this commitment to prioritize education like it did in the 1970s, when California ranked in the top five nationally in per-pupil funding.
Today, despite having the world’s fifth-largest economy, and the highest GDP of any state, California ranks 41st in per-student funding, 45th in the percentage of taxable revenue spent of education, 45th in student teacher ratios and 48th in the number of staff per student. California’s per-student funding is a little more than half that of the top states and its underwhelming student achievement numbers reflect that lack of investment.
“LCFF was a step in the right direction. In the interest of equity, it’s critical that we designate a larger share of school funding to students who have been underserved historically, such as poor students and English learners,” said CSBA President Mike Walsh. “Yet, what LCFF didn’t do is provide the funding needed to meet our challenges and give every student a high-quality education. Our low-income students, our rural students, our students of color all deserve so much more. We have a moral and an economic imperative to ensure that all students — regardless of background — have access to a high-quality education. It’s time we get real about the investment that requires.”
Troy Flint is CSBA’s Senior Director of Communications