
Measuring Accountability
Equity and the California School Dashboard
At the Natomas Unified School District’s January board meeting, trustees listened intently as the district’s principals reported their school’s performance and progress according to the California School Dashboard. Each presenter then shared actions the school will take to improve student outcomes. Natomas USD is a good example of how districts can apply the data provided in the state’s new accountability system to assess and improve efforts to close opportunity and achievement gaps for vulnerable student groups.
By Kimberly Sellery
“It was really valuable to have each principal take ownership of their school’s data,” said Natomas USD trustee and California School Boards Association Legislative Advocate Teri Burns. “It is essential that the district board review the different data points in order to assist schools in targeting interventions — the Dashboard provides an entryway for districts into that work.”
The California School Dashboard is part of an overhaul of public education in the state that aims to consider the whole child and better prepare students for life in an increasingly technological and global society. This accountability system aims to identify student subgroups that need extra help closing opportunity and achievement gaps, and paired with the Local Control Funding Formula, target designated funds to support groups such as low-income students, foster youth and English learners. The state says this system is “the next step in a series of major shifts in California K-12 schools, changes that have raised the bar for student learning, transformed testing and placed the focus on equity for all students.”

Basic Conditions (LCFF Priority 1)
Measures the availability of textbooks, adequate facilities and correctly assigned teachers.
IMPLEMENTATION OF STATE ACADEMIC STANDARDS (LCFF PRIORITY 2)
Indicates the current level of implementation based on local data (including data from the Student Accountability Report Card), using the narrative summary option or the self-reflection tool provided by the CDE.
Parent Engagement (LCFF Priority 3)
The narrative summary of the LEA’s progress in seeking input from parents/guardians in school/LEA decision-making and promoting parental participation in programs can be developed using information collected through a survey of at least one grade span served by the LEA or other local measures.
SCHOOL CLIMATE (LCFF PRIORITY 6)
LEAs will provide a narrative summary of the local administration and analysis of a climate survey that addresses student perceptions of school safety and connectedness in at least one grade within each grade span served by the LEA.
Coordination of Services for Expelled Students and Foster Youth (LCFF Priorities 9 and 10, county offices of education only)
Annual survey that measures progress in coordinating services.
Advocacy groups agree that the Dashboard is an improvement over the previous Academic Performance Index, which relied heavily upon standardized test results to assign each school a single numerical ranking. However, as the Dashboard rolls out, organizations such as CSBA, Education Trust–West and Children Now are advocating for ways the Dashboard can be adjusted to emphasize greater transparency and shine a brighter light on student subgroups that are experiencing opportunity and achievement gaps.
CSBA CEO & Executive Director Vernon M. Billy and Education Trust–West Executive Director Ryan J. Smith explained some of these issues in an op-ed for education reporting outlet Edsource in January.
“Using multiple measures to communicate not just academic performance, but a host of other important factors that shape a child’s education is a step in the right direction. But the Dashboard must go further in providing transparency, particularly in highlighting the achievement gaps of student subgroups.”
— CSBA CEO & Executive Director Vernon M. Billy
“Using multiple measures to communicate not just academic performance, but a host of other important factors that shape a child’s education is a step in the right direction,” said Billy. “But the Dashboard must go further in providing transparency, particularly in highlighting the achievement gaps of student subgroups.”
Color coding accountability
The California School Dashboard is an interactive website that displays local educational agency and school performance on several measures aligned with California’s educational priorities under the Local Control Funding Formula.
The Dashboard displays an LEA’s or school’s most recent reported performance in these areas, and tracks changes over time. Current performance statistics coupled with performance growth or decline is used to calculate an overall performance-level for several indicators. The Dashboard uses five colors to represent an LEA’s or school’s performance level, which range from high to low as follows: blue, green, yellow, orange and red (see Figure 2). A status and change report for each indicator is calculated using a 5×5 performance grid (see Figure 1), which shows whether an LEA or school has improved, stayed the same or declined in performance.
Red ratings in any two categories triggers state assistance for the underperforming subgroups. For the data in the fall 2017 Dashboard release, 228 districts will be flagged for assistance from their county offices of education because at least one student group rated red or orange in more than one indicator. According to an EdSource analysis, 561 districts have at least one student group that was rated orange or red for performance on the academic indicators but will not receive county assistance. However, each district that has student groups with a red or orange rating must recognize the low performance in its Local Control and Accountability Plan and designate strategies to improve those student outcomes.
The yellow color rating has raised alarms for several of the education advocacy organizations. “A poor performing district can languish in the yellow designation, which is so broad that it includes schools where the average student is several years below grade level and schools where the average student is above grade level,” explained CSBA’s Billy. “If a school continues to perform at the same low level, they will never be flagged for assistance.”
“A school shouldn’t be yellow or higher if significant groups of students are below grade-level standards,” said Education Trust–West’s Smith. “We can’t continue to claim the mantle of progressivism in California if we are hiding schools that are failing low-income students and students of color year after year.”
Local indicators
The indicators are divided between those statistics that are provided by the state, and those that must be provided by LEAs. The fall 2017 Dashboard release included the following state indicators:
- Smarter Balanced Assessments in English language arts and math
- English learner progress as measured by CELDT and reclassification data
- Graduation rates
- Chronic absenteeism rates
- Suspension rates
- College & Career Readiness(grades 9-12)
The current release of the Dashboard only includes one year of data for the chronic absenteeism and college and career readiness indicators, so these have not yet received color rankings.
The local indicator data uploaded to the Dashboard by LEAs include the following LCFF priority areas: basic conditions at school, school climate, implementation of academic standards and parent engagement. County offices will report on two additional priorities related to services for foster youth and expelled students. LEAs and schools upload reports about whether each indicator’s standards were “met,” “not met for one year,” or “not met for two or more years.” Meeting or not meeting the standard on local indicators is not related to LEA performance in those areas, but indicates only that they have completed the following required activities: 1) Measuring progress using local indicators; 2) Reporting the results at a regularly scheduled public school board meeting; and 3) Uploading and reporting the results to the Dashboard by December 1 each year.
“The first step in addressing achievement gaps is a clear indication on the Dashboard of whether the school or district has been flagged for assistance from the state. The state could also consider providing more information about which student groups prompted the flag for state assistance through this designation.”
— Education Trust–West Executive Director Ryan J. Smith

The education advocacy group Children Now sees room for improvement in the reporting of these indicators. “We need to strengthen the local indicators,” said Children Now Senior Managing Director of Education Policy Samantha Tran. “We think some more energy needs to be put into guidance about these indicators and to providing tools and resources to support local communities to provide evidence and engage multiple stakeholders — their teachers, their parents, their students — in meaningful ways around this information.”
The Equity Report
Another component of the Dashboard is the Equity Report, which appears on the first page of an LEA’s Dashboard data. This indicator is followed by three categories: All Students’ Performance, Total Student Groups and Student Groups in Red or Orange.
It is in the Equity Report that advocacy groups see the most cause for alarm. While a district or school’s overall rating could place it in the yellow or even green area, a look at the breakdown by student subgroup can reveal a very different story.
For example, the first page of the Equity Report for San Francisco Unified School District shows a yellow ranking for English Language Arts and Mathematics. When broken down by student group, the data reveals four subgroups in the orange category and two in the red. Without drilling down into the report, the data would seem to indicate that the students in the school are performing on an average level. “What are we communicating if we are saying this is not a serious issue that should be flagged for additional support?” asked Tran.
Another area of discussion is how LEAs and schools are identified for support; there is nowhere on the current Dashboard that communicates that information. “The first step in addressing achievement gaps is a clear indication on the Dashboard of whether the school or district has been flagged for assistance from the state,” said Smith of Education Trust–West. “The state could also consider providing more information about which student groups prompted the flag for state assistance through this designation. Local stakeholders — from parents and students to educators and administrators — all have a role to play in the continuous improvement of a school or district. Not providing an easy way to see if their school or district is receiving assistance keeps the very community members who fought for LCFF in the dark.”
CSBA’s Teri Burns explained that the State Board has heard these concerns and is working to make the gap information more readily available. “We want to be able to see right upfront which schools aren’t serving specific student subgroups,” she said. “The local district piece is the need to set more aggressive and differential targets. The State Board will need to call upon districts to do that, and display that in their LCAPs or in their budgets in a way that is easily accessible to the public.”
Figure 1: Sample 5×5 Performance Grid
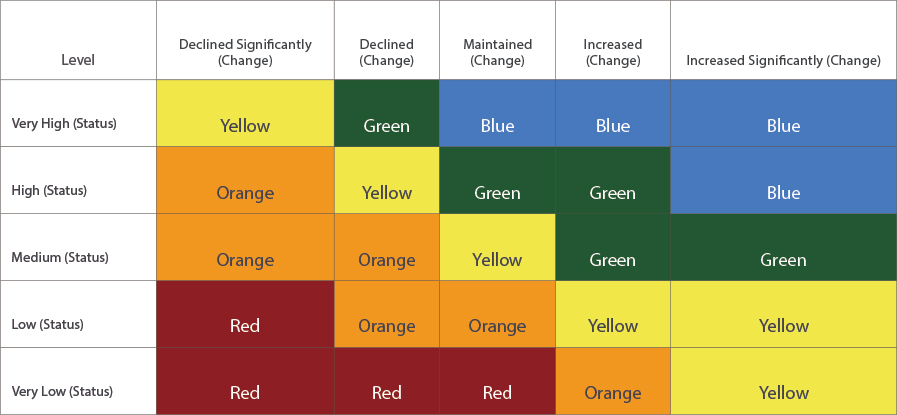
Source: California Department of Education
In an op-ed for EdSource, State Board President Michael Kirst and State Superintendent of Public Instruction Tom Torlakson acknowledged that, while there is still some work to be done to improve the Dashboard design, “with the detailed information in the Dashboard, we have a rare opportunity to turn data into direct action. … Knowing our system’s strengths and weaknesses, and tapping into our state’s incredible network of experts, will help us accelerate this work so every student has the opportunity to succeed in college, the workplace and life.”
Improving the Dashboard
One recent point of contention between education advocacy groups and the State Board was the adjustment of “cut points” in the academic indicator in the fall 2017 Dashboard release. According to summary documents presented at the State Board of Education meeting, the new cut points took into account “the central premise of California’s Accountability and Continuous Improvement System, [which] is the consideration of necessary changes or improvements based on newly available data, recent research and/or stakeholder feedback.” The documents cite the availability of only two years of “change” data as the reason for the changes to the cut points: “When the performance standards were set for the Academic Indicator, only two years of Smarter Balanced Assessment data were available (2015 and 2016), producing one year of Change data. The distributions used to set the standards were positively skewed, … over 80 percent of LEAs experienced a positive change.” When the 2017 scores did not show nearly as much positive change, the current cut scores produced dramatic downward swings and were therefore adjusted to minimize the volatility of the swings. In fact, the changes added more districts and student groups to the orange category than the prior formula.
“District and school teams can use the Dashboard, along with other local data, to identify areas in which the district is struggling and which student groups it must better serve”
— Education Trust–West Executive Director Ryan J. Smith
Smith at Education Trust–West questions the methods used by the SBE in changing these cut points. “There may occasionally be reasons to make technical adjustments to the Dashboard,” he said. “But this needs to be done through a transparent process and should be about improving the system, not watering down standards. We shouldn’t be sugar-coating schools’ performance to avoid providing state support for the educators doing the hard work on the ground.”
Education advocacy groups have flagged other areas of the Dashboard that are of concern. Both Children Now and Education Trust–West emphasized the importance of including students in alternative education settings now, while the Dashboard is still evolving. “It is critical that we include alternative education students now in the district-level data, as well as figuring out the school-level alternative accountability system,” said Tran. “If you break it out, one out of every five senior students in California is in an alternative education setting — and only one-third of those students graduate.” The State Board will be considering options for including alternative school ratings in the Dashboard this spring.
“We want the vision of LCFF and the Dashboard to become reality: to improve outcomes by directing more resources to high-need students and using a multiple-measure accountability system to support local decision-making. Now is the time to make these adjustments to the Dashboard.”
— Vernon M. Billy
Another top-line item that advocacy groups would like to see in the Dashboard is related to tracking student growth. Whereas the current Dashboard tracks change between cohorts of students — for example, this year’s third-graders compared to last year’s third-graders — tracking growth would follow the trajectory of each student year by year.
“How is every child in that school making those yearly transitions?” asked Tran. “Ideally, if we are going to close gaps, are we seeing more than a year’s worth of growth in a year’s time? Tracking growth is one of the best predictors of the impact that schools can have on learning outcomes for students because it is really about the individual student. The CDE has committed to working on this, but we have not seen any analytical models on that yet that we can dive into.”
Figure 2. Performance Levels for California School Dashboard
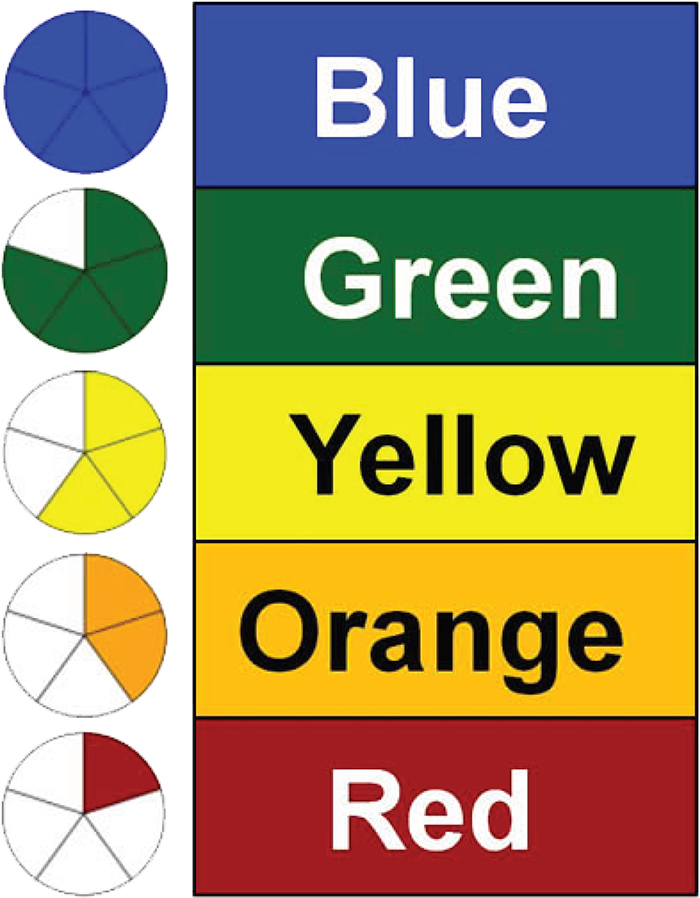
Source: California Department of Education
Using the Dashboard to support equity
While work remains to be done on improving the Dashboard, the current version can support school district and county office board members in their plans to close persistent achievement gaps. Though all of the equity information is not presented up front, clicking through the different tabs of the Equity Report will reveal subgroups that need extra help.
“District and school teams can use the Dashboard, along with other local data, to identify areas in which the district is struggling and which student groups it must better serve,” said Smith. “Working together with [stakeholder] groups and using the Dashboard to identify gaps and needs can help districts create a solid action plan that is then integrated into LCAPs and other local planning documents. Lastly, it is crucial that the district communicate their plan to address inequities to the broad range of stakeholders in the district.”
Added CSBA’s Billy, “We want the vision of LCFF and the Dashboard to become reality: to improve outcomes by directing more resources to high-need students and using a multiple-measure accountability system to support local decision-making. Now is the time to make these adjustments to the Dashboard.”
Kimberly Sellery is managing editor for California Schools.